Korean hair care, a small US foothold, no US team. In July, Light Anchor's agents took over its creative, ads and storefront.
- 9.1xDaily Amazon salesSep 1–15 vs June 2026
- 9.6xWeekly branded searchesSep 6–12 vs June 2026
- 85%AI-generated ad creative118 of 139 Meta placements

K-beauty hair care for dry, damaged and color-treated hair: whipped shea and green tea in a jar, 50,000+ jars sold in Korea.
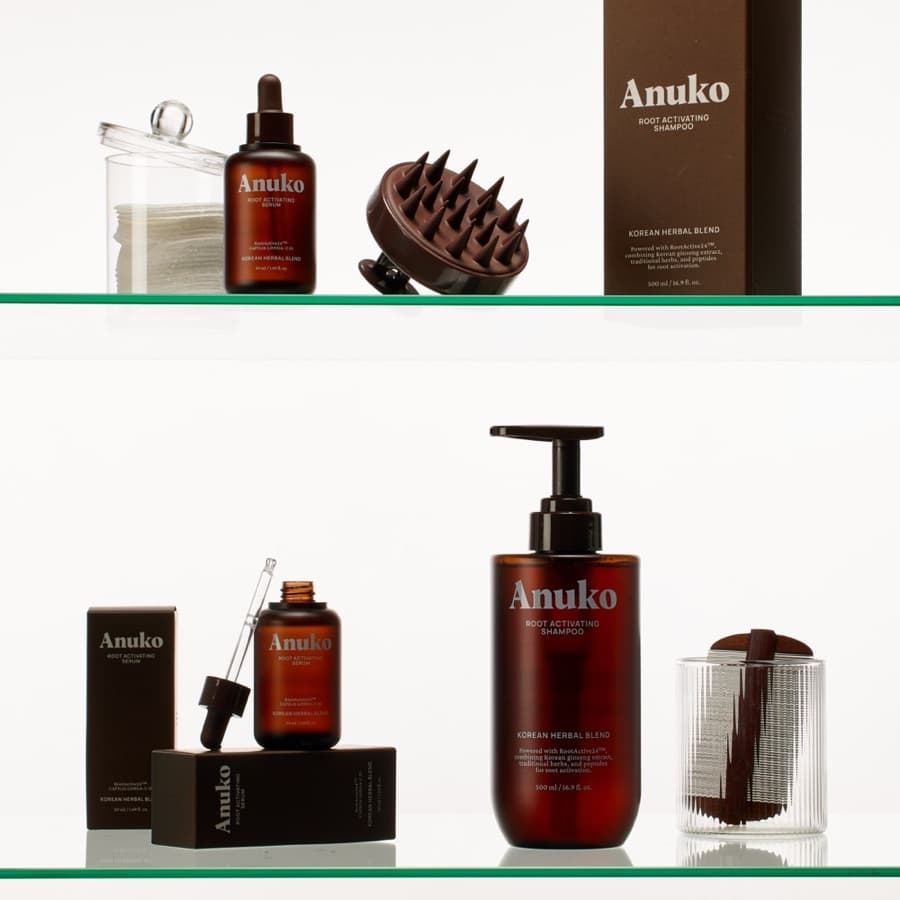
The US was next. Anuko had a small Amazon foothold since 2025, and neither the people nor the budget for a conventional expansion team. In July 2026 it handed over.
Anuko brought the product, the brand assets and the stock. Light Anchor's agents brought the operation: research, creative, ads, landing pages, storefront and the monthly report, under Anuko's name.
- Category
- K-beauty hair care
- Hero product
- Nourishing Hair Butter
- Range
- Hair Butter, Travel Butter, Root Serum
- Storefronts
- Amazon.com, tryanuko.com
- Home market
- Korea
- Reviews
- 2,000+
- Handed over
- July 2026
We had 50,000 jars sold in Korea and nobody in the US. In July, Light Anchor's agents took over the ads, the landing pages and Amazon. By September our daily sales were nine times June's, and all we do is read the report.
 Anna Ahn, Founder, Anuko
What the reports showed: Amazon sales per day and brand searches per week, both indexed to June 2026. Agents from July 7.
| Period | Multiple of the baseline |
|---|---|
| Feb 2025 | 0.09× |
| Mar 2025 | 0.03× |
| Apr 2025 | 0.08× |
| May 2025 | 0.03× |
| Jun 2025 | 0.03× |
| Jul 2025 | 0.04× |
| Aug 2025 | 0.10× |
| Sep 2025 | 0.33× |
| Oct 2025 | 0.23× |
| Nov 2025 | 0.75× |
| Dec 2025 | 0.44× |
| Jan 2026 | 0.59× |
| Feb 2026 | 0.68× |
| Mar 2026 | 0.54× |
| Apr 2026 | 0.99× |
| May 2026 | 0.82× |
| Jun 2026 | 1.0× |
| Jul 2026 | 2.1× |
| Aug 2026 | 2.8× |
| Sep 1–15, 2026 | 9.1× |
| Period | Multiple of the baseline |
|---|---|
| Jun 7 | 0.88× |
| Jun 14 | 0.90× |
| Jun 21 | 1.2× |
| Jun 28 | 1.0× |
| Jul 5 | 1.6× |
| Jul 12 | 3.0× |
| Jul 19 | 2.9× |
| Jul 26 | 1.2× |
| Aug 2 | 1.1× |
| Aug 9 | 1.2× |
| Aug 16 | 1.4× |
| Aug 23 | 3.4× |
| Aug 30 | 4.7× |
| Sep 6 | 9.6× |
June1×
The baseline. A small Amazon foothold since 2025 and no US team.
July2.1×
Agents launch the first Meta ads on the 7th. A retrospective sets the rule: purchases, not clicks.
August2.8×
The ad library grows and the landing pages iterate. Monthly sales 2.9x June.
September9.1×
Three AI-generated ads drive 46% of matched purchases. Searches for Anuko reach 9.6x the June week.
- Sales: payment-complete Amazon.com sales per calendar day, Sep 1–15 vs Jun 1–30, 2026, a Seller Central snapshot of Sep 17. Searches: Amazon queries with the brand's terms, the week of Sep 6–12 vs the average of Jun 7–Jul 4.
- Creative: 118 of 139 Meta placements in the creative registry are AI-generated. Brand facts are Anuko's own.
- Observed during the program, not a controlled test. Meta spend per day rose 3.2x from August to September, as did sales per day.